We promise to produce the best products with our long experience and practical know-how, and become a company that always does its best.
A-ONE Emulsion is constantly striving for a better tomorrow.

Warm Mix Asphalt (ECO)
The medium-temperature asphalt (ECO) is an eco-friendly, high-quality medium-temperature asphalt that lowers the production and installation temperatures by 30℃ compared to the thermal asphalt paving method.
Effects of Application
- 0130% reduction in fuel consumption
- 02Decreased installation temperature
- 03Earlier traffic opening time
- 04Prevention of winter compaction problems
- 05Reduction of odor and smoke due to reduced harmful substances
| ※ Comparison of fuel and harmful gases generated when producing 1 ton of asphalt | |||||
|---|---|---|---|---|---|
| Category | Fuel (L/ton) | Dust and noxious gases | |||
| Carbon dioxide (%) | Nitrogen oxide (ppm) | Sulfur oxide (ppm) | Carbon monoxide (ppm) | ||
| HMA | 9.3 | 16* | 30 | 210 | 1,040 |
| WMA | 6.3 | 1.9* | 20 | 160 | 850 |
| Savings | 32.3% | 88.1% | 33.3% | 23.8% | 18.3% |
(Source: Korea Institute of Construction Technology)
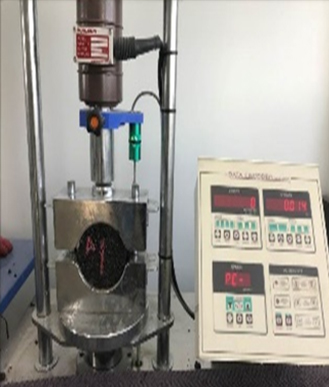
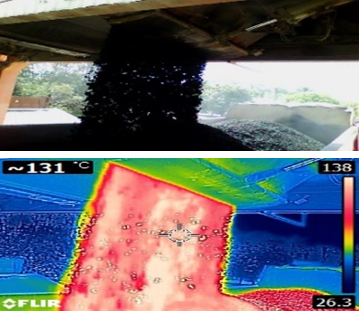 Production
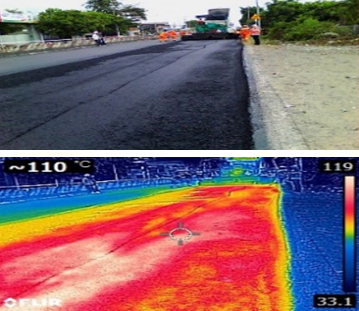 1st Compaction
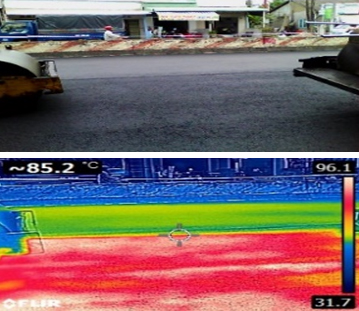 2st Compaction
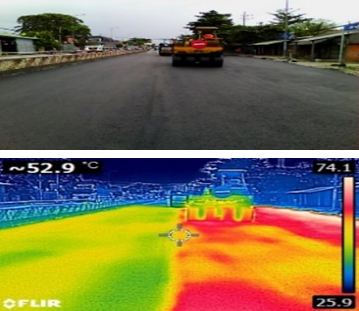 3st Compaction
ECO Mixture Quality Test Results
| Types | Compaction Temperature (℃) | Porosity (%) | Marshall Stability (N) | Flow Value |
|---|---|---|---|---|
| Normal | 140 | 4.1 | 13,000 or more | 23 |
| Warm Mix | 140 | 2.3 | 15,000 or more | - |
| 110 | 3.9 | 11,000 or more | 27.3 |
Based on Daesan Chemical’s Lab Test Results
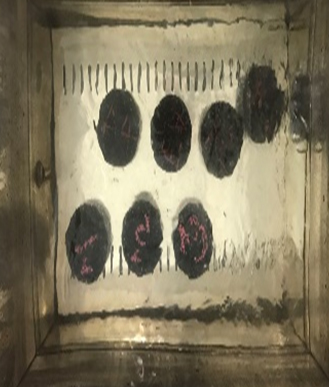
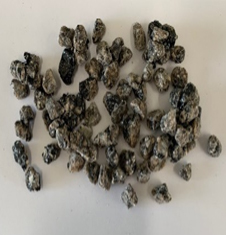
Results of Dynamic Immersion Test
| Results of Coverage Comparison Test (%) | |
|---|---|
| General AP-5 | ECO |
 |
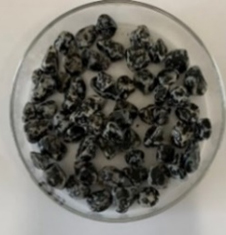 |
| Less than 10% | 65% or higher |
Increase in bonding strength between aggregate and asphalt verified
Improved mixture performance due to improved adhesion performance
Improved mixture performance due to improved adhesion performance


Company
A-ONE Emulsion Co.,Ltd.
Owner
Shim Sung-Hoon
Business License
180-86-00159
E-mail
a-onebitu@hanmail.net
- Headquarters Address in Ulsan
- 9-10, Jeomchon 6-gil, Beomseo-eup, Ulju-gun, Ulsan Metropolitan City, 201ho, South Korea. Tel +82-52-269-7877 Fax +82-52-700-7879
- Gyeongju Factory Address
- 153, Naengcheonjenae Industrial Complex-gil, Oedong-eup, Gyeongju, Gyeongsangbuk-do, South Korea Tel +82-54-771-1450~2 Fax +82-54-771-1455
- Seoul/Gyeonggi Branch Address
- 1403, 26, Ori-ro 876beon-gil, Cheolsan-dong, Gwangmyeong-si, Gyeonggi-do, South Korea (Miseong Office Building 2nd Phase) Tel +82-70-4607-1699 Fax +82-52-700-7879
Copyrightⓒ 2021 A-ONE Emulsion. All rights reserved.